NumbersMR can now generate and display charts based on cross-tab tables. This makes it easier than ever to build visual representations of complex analyses as well as compare data sets across variables, questions and projects.
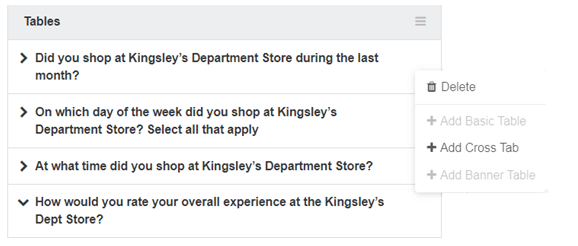
You can add a cross tab for any question by clicking on ‘Add Cross Tab’ in the menu for that table set.
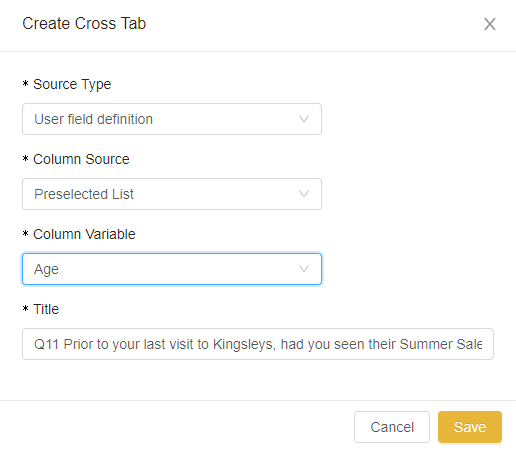
There are 4 steps to creating your cross tab tables in the pop-up screen:
- Survey
- Poll
- User field definition
Then click ‘Save’ to create the cross tab.
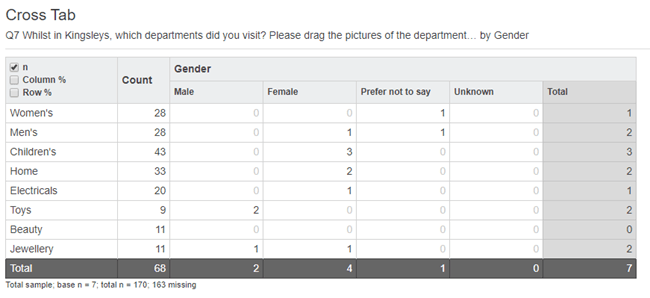
Click on the cross tab label on the left side of the screen to view the table.
You can choose to ‘NET’, ‘merge’, ‘hide’ and ‘exclude rows and columns’ in the same way as with the basic table by hovering over the column/row and clicking on the arrow for the options.
You can also swap between showing row or column % for cross tab charts, in place of or alongside the numbers, by ticking the appropriate box(es) in the top left corner of the chart.
From the table set menu, you can delete or change the name of the cross tab.