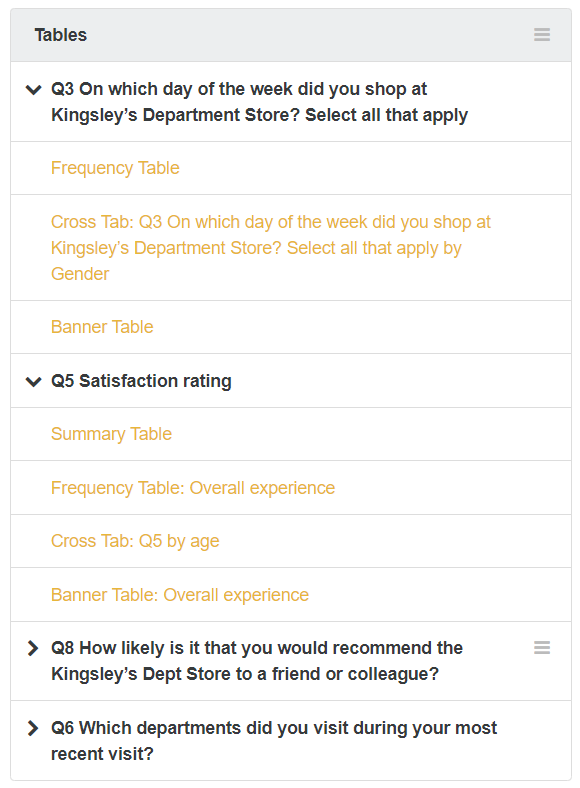
Click on the arrows on the left-hand side to expand the table sets.
Click on the table to expand it in the pane on the right.
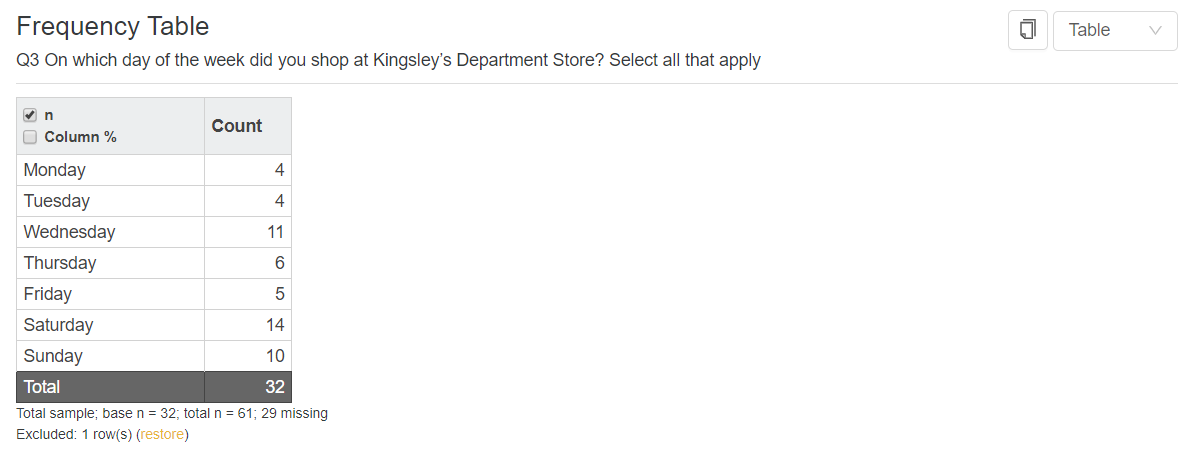
You can choose to show ‘column%’ AND/OR ‘n’ on each frequency table by using the tick boxes in the top left of the tables.
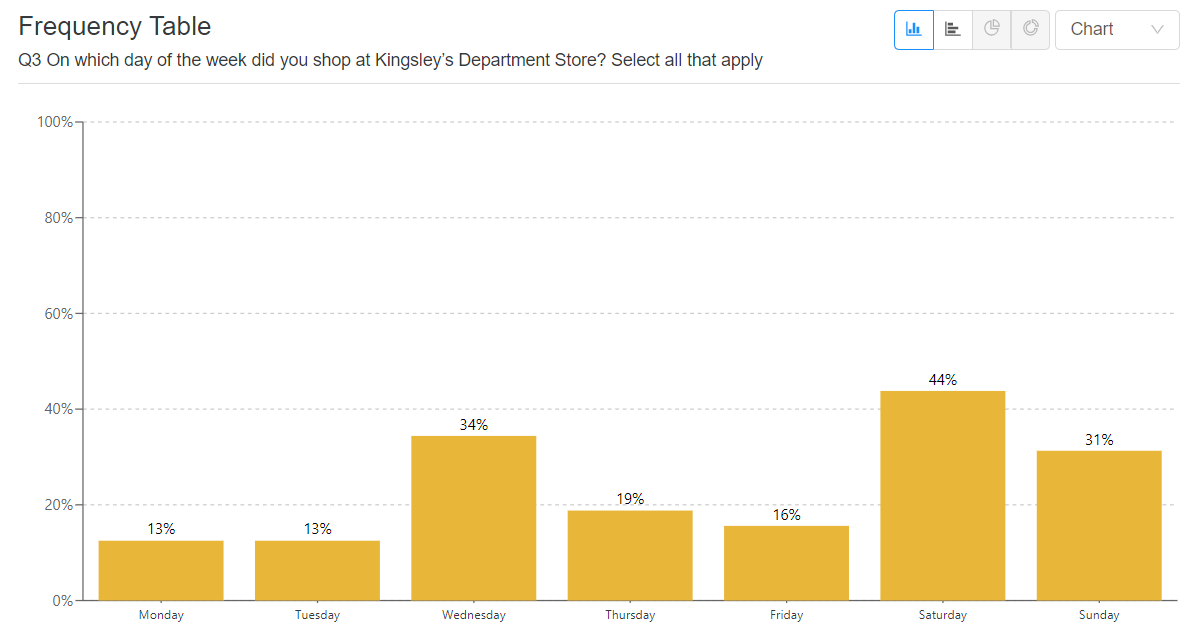
On the right hand side of the page you can see a drop-down that says ‘table’. You can choose to see a chart instead using that drop-down.
Grid Questions
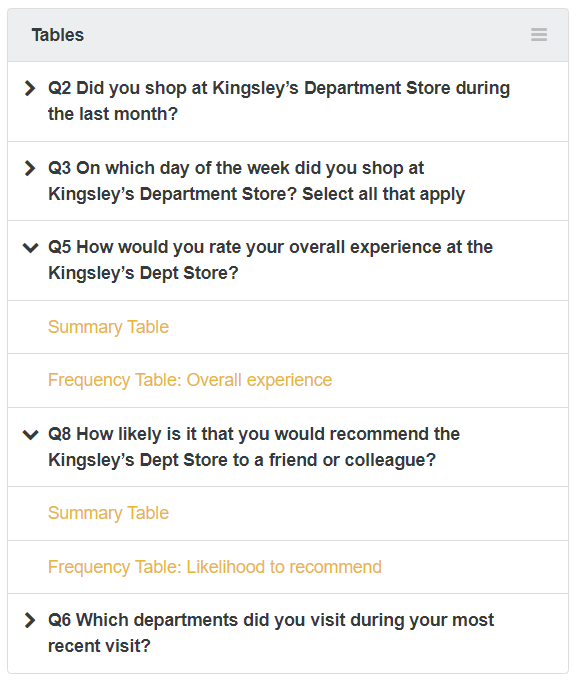
- As a summary table. The table is laid out as it would appear to the survey respondent where sub-questions are rows and answer options are columns.
- Summary tables can show ‘n’, ‘Column%’ AND/OR ‘Row%’
- Summary tables can be viewed as tables or charts
- Each sub-question is listed as a separate table. You will see the name of the question, followed by the sub-question label as the table name.
You will see the name of the question followed by the sub question label as the table name.
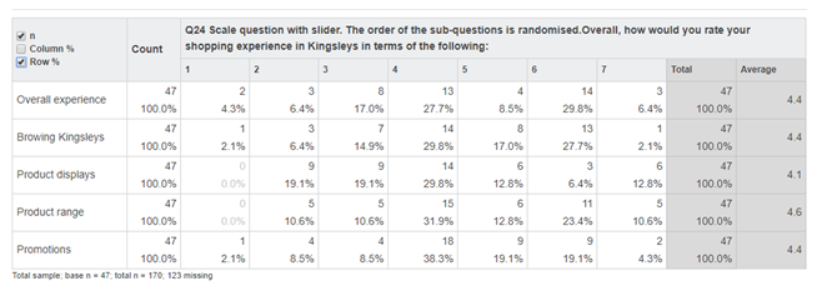
Scale Questions
- As a summary table. The table is laid out as it would appear to the survey respondent where sub-question(s) are rows and the scale is the columns.
- Summary tables can show ‘n’, ‘Column%’ AND/OR ‘Row%’
- Summary tables can be viewed as tables or charts
- If you have more than 1 sub-question in a scale question, each sub-question is listed as a separate table. You will see the name of the question followed by the sub-question label as the table name.
Interacting with the Table
If you hover over the rows of the table, you will see a little arrow on the right-hand side of each cell in the first column. If you click on the arrow you can see a drop-down with available options.
To select more than one row at once, hold down CTRL (or CMD on a Mac) on your keyboard, then select more than one row. After this you can click on the arrow of one of the selected rows for the options.
- Create NET (only available if more than one row is selected)
- Merge (only available if more than one row is selected)
- Hide
- Exclude
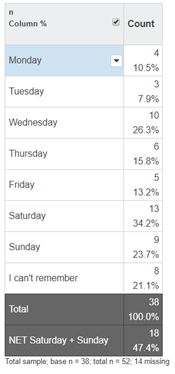
Create NET
The ‘NET’ combines rows, which are displayed at the bottom of the table.
You can delete the netted row. To remove it hover over the row, click on the arrow and select ‘delete’ from the drop-down.
A ‘Net’ will not affect your original data in the table.
Merge
Merge allows you to combine results within a cell.
If you have merged rows, you can then choose to split them again as a new option will appear in the drop-down options of the merged row.
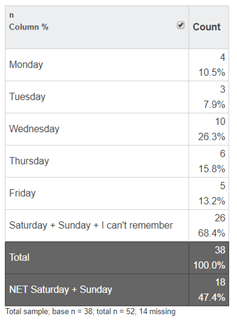
Note: rows don’t need to be adjacent to each other for you to merge or NET them.
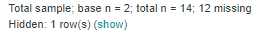
Hide
When you hide a row, you will see a note of how many rows are hidden at the bottom of the table.
You can then choose to show those rows again by clicking the ‘show’ link.
Exclude
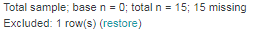
When you exclude a row, you will see a note of how many rows are excluded at the bottom of the table.
- When you exclude a row, your table will rebase the data in the table.
- You can then choose to restore those rows by selecting ‘Restore’ at the bottom of the table.
A row which is used in a NET cannot be excluded.
Merged, Netted, Hidden and Excluded row changes will be reflected in the accompanying chart, found in the dropdown on the top right.