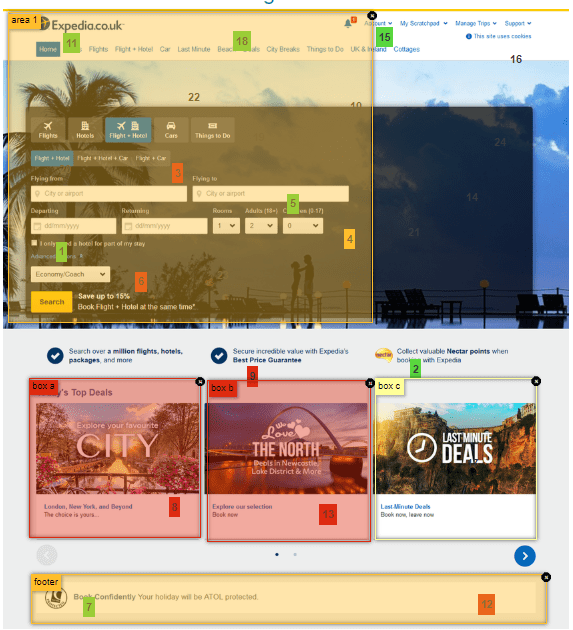
If you had the sentiments switched on when running your Smartboard, on the results page you can map areas of your Smartboard to show these tags in a visual way.
To set-up the 'mapped areas' you can click into the image and drag over the area you would like to select, you will be prompted to add a label for each area you create. The image with mapped areas can be exported and then you can start again mapping different areas of the image to get verious perspectives form the same image/comments.
The mapped area will turn the colour of the sentiment average accross all of the comments included in that area (e.g. positive = green, neutral = orange, negative = red).
Downloads
You can download the Smartboard image and/or annotations from the main Smartboard view or 'responses' tab in the Back Room using the icons above the image ![]()
You can download the image with mapped areas from the 'results' tab: