NumbersMR can be accessed via: Back Room > Analytics Tools > NumbersMR
The first page you see is the main NumbersMR page that lists all the analysis sets that have been previously created:
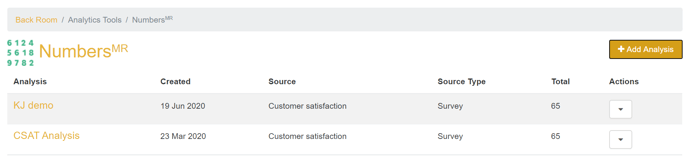
From here you can see the analyses that have been created, including:
- The date the analysis was created
- The source of the data in the analysis
- The number of users who are used in the analysis
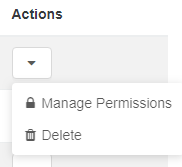
Through the actions drop-down, you can also manage permissions and delete the analysis:
When you select 'manage permissions' you will see the pop-up below:
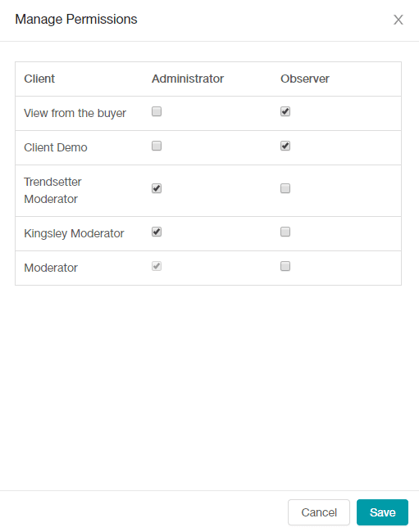
For an observer of the analysis, you don't need observer rights over the survey previously, as it's assumed that by giving the client account observer rights for the analysis, you're ok to give them rights to see the survey questions and results via NumbersMR. However, that won't give them rights to view it on the surveys page, if they don't already have those rights.
Administrators
- Administrators can add & edit tables in the analysis set
- Any interaction where you need to specify a source (questionnaire) or variable (question) you must have admin rights over that source/variable
Observers
- Observers can only read the contents of an analysis set
- Observers can't edit banners
- For observers, all of the table interactivity is disabled (with the exception of the ‘show percentages’ option)
- For observers, below the statistical summary, the display information should show the number of hidden rows/columns, but with no ability to show them
Creating an Analysis
To create a new analysis, click on the ‘Add Analysis’ button in the top right of the main NumbersMR page. Choose your source type and specific source for the analysis from the drop-down lists and give your analysis a name:
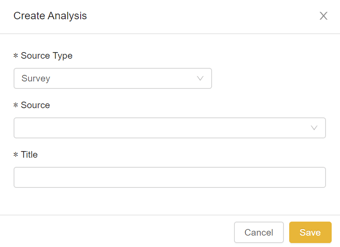
Then click save to begin.
The Analysis Screen
When you have created a new analysis or have clicked into an existing analysis, you will see a list of all questions of eligible types down the left hand side under ‘tables’. These are ‘table sets’.
When you click on the name of a question, you will see a list of tables for that question. There will be a frequency table by default.
You can copy the tables created in NumbersMR and paste them into another document (e.g. Excel) by clicking onto the icon next to the tables/chart drop-down.
![]()
You will receive a confirmation pop-up to inform you that the table has been copied to your clipboard and you can then use ‘paste’ to insert the table figures into your preferred document type, the tables will paste without formatting.