You can pre-set the data fields you are most interested in seeing, such as Age, Location, Segment, etc., and you can change, refresh or add to it at any time.
Creating an All-Panel profile
An all-panel profile will reflect the information for your panel as a whole. You can also create panel profiles that are specific to individual projects. More on project-specific panel profiles later in this page.
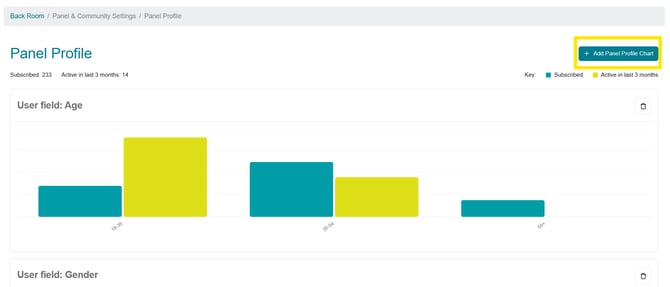
In the backroom for your InsightHub, go to the option for Panel & Community Settings and select the option for Panel Profile.
Click the Add Panel Profile Chart button in the top right of the page to begin adding data charts to your panel profile.
You will see a list of User Fields from which you can create your chart. The specific fields included in that list will depend on the database setup of your InsightHub, but will likely include important demographic and segmenting information, such as Age, Gender, Segment, Products Owned, etc. See below example.
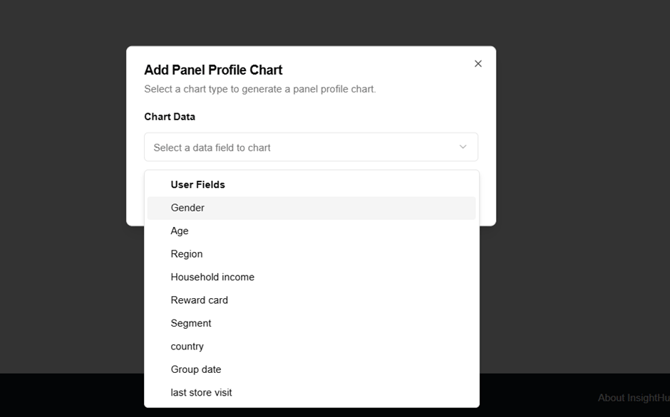
Select the user field you wish to display, and click the Create Panel Profile Chart button. This will automatically generate a chart, based on the member information in the database. The chart will display figures for all subscribed members, and for members active in the last 3 months.
Tip- You can find more information on the specific percentage/number for each data point, by hovering over the relevant chart and reading the extra information in the tooltip.
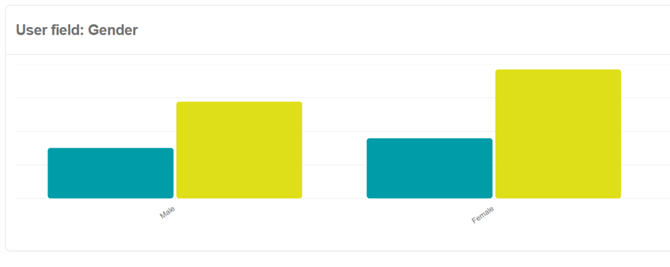
You can continue adding more charts to your Panel Profile, by returning to the Add Panel Profile Chart button in the top right, and selecting any other user fields you wish to display, adding a chart for each. Each chart will be displayed below the previous one, giving you a snapshot of your overall panel spread across the selected charts.
Creating a project-specific Panel profile
Project-specific panel profiles have all the same features and functionality as all-panel profiles, but allow you to create a profile that includes only consumers within a specific project. This is ideal if you would like to be able to view a more granular breakdown of smaller groups within your panel, going by project membership.
To create a panel profile for a specific project, go to the page of the project you wish to create a panel profile for. From the tabs along the top of the project page, select the Profiling tab.
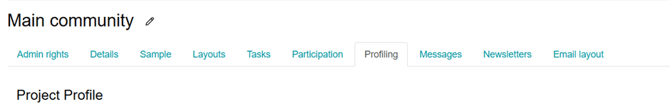
From here, you can follow the same instructions above to create your panel-specific profile.
Notes:
Each chart displays a figure/percentage for both Subscribed members, and for members active in the last 3 months (Definitions below).
The Panel profile will only include consumer accounts, not admin or client accounts.
You can refresh any of the charts at any time by using the refresh icon found in the top right of each chart.
You can delete any of the charts at any time by using the trashcan icon at the top right of each chart.
Definitions –
Subscribed - All consumers who are not unsubscribed on the platform (whether they have logged in or not).
Active in the last 3 months - Subscribed consumers who have either logged in or done an activity through an open link (e.g. a survey) in the last 3 months.